Regression Modeling Strategies: Ordinal Regression for Continuous Y
This is the 15th of several connected topics organized around chapters in Regression Modeling Strategies. The purposes of these topics are to introduce key concepts in the chapter and to provide a place for questions, answers, and discussion around the chapter’s topics.
To evaluate if BMI of height/weight measurements do better, why is the ratio of log height log weight is -2.4? How did you compute -2.4? Is it always -2.4? Why did you use a log-log model? Why not linear model? Log BMI = log weight minus 2 * log height. So on the log scale BMI assumes the ratio of coefficients is -2, and we check that by fitting log height and log weight as separate variables.
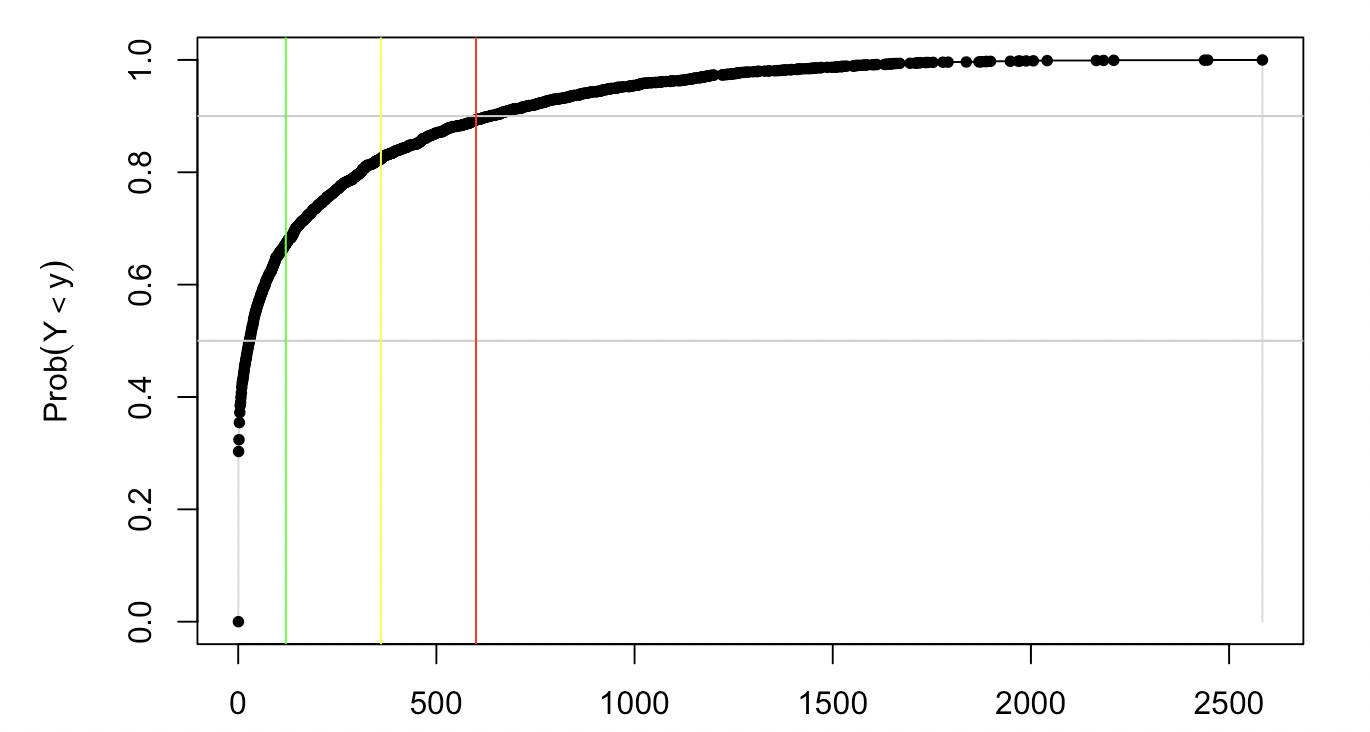
I have a question regarding contrasts in orm models for continuous outomces. I have built an ordinal regression model for a continuous outcome (minutes vigorous physical activity per week) that is bounded at 0 and skewed. Quite a few observations are 0, about 26%. As far as I know, these issues should not pose a problem for these kind of models.
The model contains one focal categorical predictor with four groups and some adjustment variables. The book and course notes nicely explain how to get predicted values and plots for various functions (the mean, median, quantiles etc.). I have no problem creating predicted values with compatibility intervals for each group separately. However, my goal is to present contrasts/differences between predicted values for the four groups. For example, I’d like to say something like this (assuming that the model contains only the groups, BMI and age included with splines):
Fixing BMI at 25 and age at 30, the estimated difference between the medians of group 1 and 2 is XY (95%-CI: …).
I couldn’t figure out how to do this using Predict or contrast.
Or would you recommend presenting contrasts of coefficients? I find that harder to interpret compared to predicted values.
On a different note, I’d appreciate an example using ExProb with conf.int. The function returns an error must specify X if conf.int > 0 but the documentation of ExProb doesn’t state what X is in this case.
I’m less clear about compatibility intervals right now but contrast() will provide the contrasts you seek, e.g., contrast(fit, list(group=1, bmi=25, age=30), list(group=2, bmi=25, age=30).
The trick with ExProb is that you have to see which arguments it creates in the generated function, and if the first argument is not the linear predictor, you need to create a little wrapper function that transfers its first argument to the appropriate one in the generated function.
I think I can get the contrasts on the level of the linear predictor but I’m struggling to convert the contrasts to differences of predicted means or medians. For example:
qu <- Quantile(mod) # mod is an orm-model
med <- function(x) qu(0.5, x)

Predict(mod
        , vgroup = c("0", "1")
        , fun = med
        , conf.int = 0.95
)

  vgroup age sex      BMI education_level living_with_others_y_n location     yhat    lower    upper
1      0  41   2 23.23563               5                      1        1 2849.239 2433.784 3311.387
2      1  41   2 23.23563               5                      1        1 2559.827 2011.234 3243.239
The difference of the predicted medians between the groups is 2849.24 - 2559.83 = 289.41. Applying contrast:
The contrast of -0.15 is identical with the coefficient for vgroup=1 as vgroup=0 is the reference level. But supplying fun to the print function in order to get difference in medians instead of coefficients doesn’t seem to get the correct contrasts:
print(ctrst, fun = med)

 age sex      BMI education_level living_with_others_y_n location Contrast S.E.    Lower    Upper    Z
1  41   2 23.23563               5                      1        1 1899.218   NA 1498.216 2415.777 -0.9
  Pr(>|z|)
1    0.367
The difference of 1899.22 is much higher than expected. What am I missing here?
My apologies. fun= is an argument to contrast.rms (not print), but it’s only implemented for (1) a Bayesian model fitted with rmsb::blrm or (2) simple transformation such as anti-log. If you don’t want to do this with a Bayesian model (which provides exact inference for complex derived parameters such as the mean and quantiles) the best bet is to bootstrap the estimated differences to get a bootstrap confidence interval. The rms::bootcov function will produce a helpful matrix of bootstrap regression coefficients but that doesn’t help you plug them right into the derived parameter calculation, so you might as well bootstrap orm fits.
ExProb is a ‘prob’’ (frustrating)—but so important: it needs to have less friction in utilization to be more widely used. And it does really need to be more widely used. Where is this trick and any other crucial tricks explicated? Where can we find examples that help us employ this—and in the process encourage the wider use of the marvelous ordinal regression for continuous Y?
Thank you for ExProb. Thank you in advance for making ExProb ‘not a prob’’.
Exceedance probabilities, and ExProb(), are “Supercalifragilisticexpialidocious”!!! [Once figured out] expressing outcomes in this way is a tremendous compliment to estimated conditional means, medians, quantiles, etc. Outcome metrics derived post-fitting—after fitting a model on the highest information dependent variable—is an Ninja-nalysis move.
I am wondering if ordinal regression (or any of the other methods mentioned in this chapter) would be appropriate if there is a time component. In survival analysis, like Cox regression, we predict time to a binary (or I think sometimes ordinal) event. Is there an equivalent analysis method for when you have a continuous outcome?
My data: Cohort study with 3 waves (~ 5 years between each wave). I am using covariates measured at baseline to predict a continuous outcome at an individual’s last follow-up. From what I have seen, all models doing similar analyses end up dichotomizing the outcome and using a Cox or Weibull model.
Based on the discussion in this post, I believe I can’t add follow-up time to the predictors as it was not measured at baseline and is considered an outcome variable. But I have been unable to find an equivalent to survival analysis for continuous outcomes.
Perhaps, since there is no “event” per se, we don’t have to worry about censoring and can simply ignore the follow-up time? The issue I have then is I’m not sure how useful a model without a time horizon would be.
Maybe I could say this model predicts the 15-year outcome? In that case, I’m not sure if I should impute wave 3 outcome for those who were lost to follow-up after wave 2. I know that predicting Y is not usually recommended so I wonder if it’s better to just ignore those with missing wave 3 outcome.
I hope this doesn’t read too much like a train of thought. I’d be happy to further clarify anything.
There are at least two classes of problems related to your question:
studies in which a continuous or ordinal measurement is made at the time of the event but not before the event
longitudinal studies where an ordinal or continuous marker is collected repeatedly
For the first situation, the method of Berridge and Whitehead applies. For the second it’s best to think of this as a longitudinal ordinal outcome with the event at the top end of the ordinal scale. For examples and method of doing longitudinal ordinal analysis see this.
Thank you. The second situation is closer to my data. With proportional odds / ordinal regression, it seems like the end model will need to be interpreted as log odds or probability of an event. Which means we do have to categorize the outcome (albeit after the analysis) for interpretation and I would like the final model to be able to predict an individual’s future outcome value rather than the probability of that value being above/below any thresholds.
Your comment mentioned this being a longitudinal outcome which reminded me of generalized least squares (GLS). Looking back at my notes, it looks like I was considering that as a potential modeling strategy when I first proposed this project (I have a terrible memory). Is there any reason that would not be appropriate for my data?
GLS is great for fully continuous Y with no event overrides. Ordinal Markov models are similar and more general. There is nothing about the ordinal model that makes you need to categorize anything. You can have as many levels as you want. I don’t know where you got the idea that categorization was needed.
Sorry, categorization isn’t the right word as we’re not changing the outcome variable. But for an ordinal model, aren’t we trying to estimate the probability of Y >= y (given X)? Which means we need at least one cut-off (y). Unless I’m misunderstanding, we can’t ask what will be this individual’s Y in 5 years, instead we can ask what is the probability that this individual will have a Y>=y in 5 years (or probability that Y is between y1 and y2, etc.).
You can use an ordinal model to estimate \Pr(Y \geq y | X) for anyy. So you can use all possible cutoffs, without changing the data. You can also compute \Pr(Y = y | X) and \Pr(a \leq Y \leq b | X), E(Y|X) and quantiles of Y|X.
Thank you, I think I understand. I believe GLS (or maybe GLMM) will be better for my situation as I don’t want a probability as the outcome, but the predicted future value of my marker. For some reason it took me a whole two days to realize that there is an “odds” in the model name and that it uses a logit function which should have hinted what the outcome would look like!
You’ve missed the point. The fact that probabilities are used as the initial statement doesn’t mean you can’t get “regular” outputs. After all you can phrase the ordinary linear model as \Pr(Y \leq y | X) = \Phi(\frac{y - X\beta)}{\sigma}). But from that model you can still get E(Y|X) = X\beta. I have case studies in my RMS course notes using ordinal regression as a replacement for GLS.
Having “odds” in the name of the model does not hint what the outcome looks like other than to assume it’s either discrete ordinal or continuous.
Can ordinal regression apply to when my outcome variable has directionality?
A particular case is when 0 is the reference point, and negative numbers and positive numbers both represent extreme. For example, in looking at range of motion/flexibility of the hip, age can influence how stiff you are. Extreme numbers of better, but close to 0 is not as good. Another would be that one particular muscle is affected, so the patient is able to rotate his hip one way (ie. the positive direction), but not the other way (ie, the negative direction).