For continuous variables you might use the more robust and efficient Wilcoxon signed-rank test and its associated point estimate the pseudomedian (median of all possible pairs of differences from pre to post). For binary variables McNemar’s test does seem applicable, and get a confidence interval for a probability that is part of this test. If memory serves, McNemar’s is based on the following if X is pre and Y is post: P(Y > X | Y \neq X) = P(\Delta > 0 | \Delta \neq 0) where \Delta = Y - X. You can compute Wilson’s confidence interval on this probability after removing all the tied observations. You can also get confidence intervals on unconditional probabilities e.g. P(Y = X).
1 Like
Hi Professor @f2harrell,
Apologies for the mistake, sometimes it’s not clear to me where to post my questions. I hope this is now placed in the correct topic. Please let me know if that’s not the case.
50 subjects received 2 interventions. The order of the interventions was randomized. The subjects were assessed before each intervention (Pre), immediately after (Post_1), and then one more time (Post_2). Each experimental session (Pre + Intervention + Post_1 + Post_2) lasted about 1 hour and took place on a different day (2 days total). The attached Plot shows the mean response (with a 95% nonparametric confidence band) on each time for each intervention.
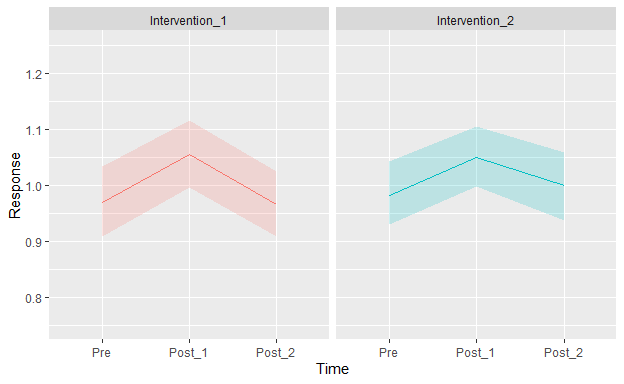
The interventions are the same, but one is a “stronger” version of the other.
I’m a bit confused with this design as it includes 2 within-subjects factors, namely, intervention and assessment time.
The goals are:
- To test for an intervention effect from Pre to Post_1;
- To test for a different intervention effect between the 2 interventions;
- To test for a “recovery” effect from Post_1 to Post_2 (i.e., what value the response returns to);
- To test for a different “recovery” effect between the 2 interventions;
I tried to model these data using the approach suggested here: Biostatistics for Biomedical Research - 7 Nonparametric Statistical Tests
For exemple:
f <- ols(response ~ intervention * time + id)
Where “intervention” and “time” are modeled as categorical variables.
But I’m not sure this is correct, because I have 3 measurements per subject for each intervention, whereas in the BBR example each subject has only 1 measurement per condition (drug).
I think I could reduce the 3 measurements per subject to only 1, using for instance the AUC for each subject’s curve. But then I don’t know how I could address the goals from above. By comparing the mean AUC between the 2 interventions I would simply be testing for an overall difference between the interventions. I think this would be a limitation of any summary measure.
Does anyone have any suggestion?
Thank you.
Dear Professor @f2harrell,
Section 7.9 of BBR says that Regression can be used to analyze multi-period crossover studies. Are there any examples available on BBR, RMS, or here? I’m struggling with the case above.
No examples. Take a look at Stephen Senn’s book on crossover studies. I’ll bet the prevailing way to handle that is using subject random intercepts just as you can do with 2 periods.
1 Like
Ok Professor,
Thank you!
Dear Professor @f2harrell,
I’m a bit confused with regards to the analysis presented in Section 7.8 of BBR. There we have a case of a PO Model being applied to a type of experiment where one of the factors (surface) seems to be a within-subjects factor. However, the model does not include ‘subject’ as a predictor and thus it does not seem to be taking into account the repeated measurements within subject:
f <- orm(y ~ sex + surface, data=d, x=TRUE, y=TRUE)
Am I missing something?
Thank you for your time.
I was assuming that the two surfaces yield uncorrelated observations.
1 Like